Full stats & insights
Knowing your ingested calories is based on recording that information and then being able to see it clearly and concisely. To do this, one of the most effective ways is graphics.
At iUcalorie we put at your disposal a large number of graphs, data and information that will allow you to clearly see where you were, where you are and what you need to achieve your fitness goals.
Dashboard
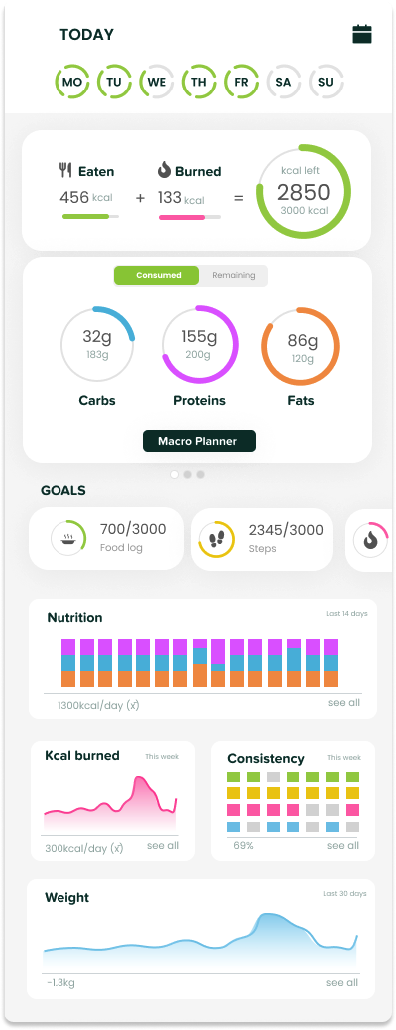
The graphs on your dashboard show you the most immediate information that you need to see to know where you are today, this week and in some cases a longer period. You can see your nutritional information for the day, how is the progress of your daily goals or even see a small history of the last 14 days of nutrition, how is your weight trend in the last 30 days and much more.
This short-term vision will help you motivate yourself and be consistent on a daily basis in relation to what you must do to achieve your fitness goals.

Monthly and yearly vision
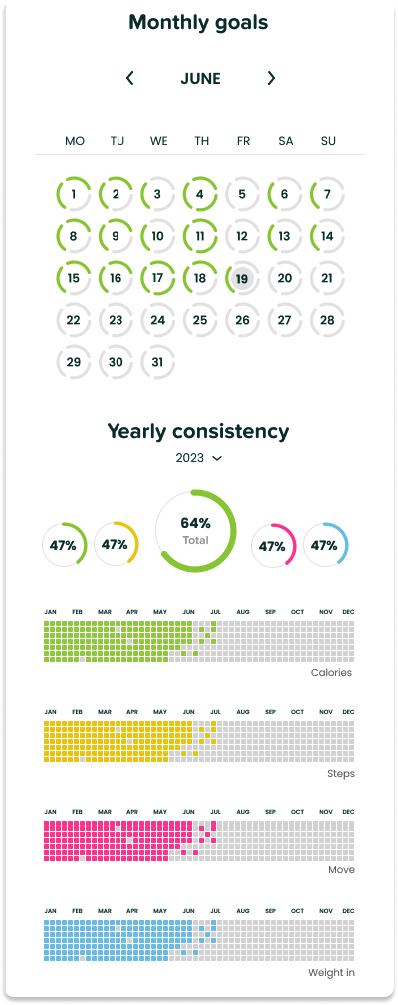
On the other hand, you can also see the evolution of your goals month by month in a visual way or even your consistency with respect to the whole year.

Charts and filters
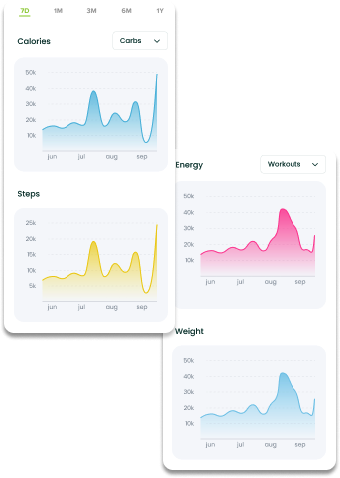
You can filter your main data by different periods of time. For example 7 days, 6 months or even a year. In this way you can have both a short-term and annual vision.
In the calorie graph, you will be able to see the evolution of your macronutrients separately and thus compare, for example, with your weight graph and see if there is a direct relationship.
